Everyone! We've moved to WordPress.

Are Your Formulas All "Wrapped" Up?

3
The other day, there was a discussion on one of the LinkedIn Excel Groups regarding wrapping formulas in the formula bar. Today. I'll take a look at wrapping and indenting formulas complete with screen shots and a workbook you may download at the end.

The Data

First, I'll need some data. I use Dick Kusleika's Random Data Generator to get some quick data. I selected the fields I needed to generate and voila! 20K records very quickly.


I converted the entire range of data to an Excel Table. I named the table, "tblData"

The Analysis

To analyze the data I went to another sheet and setup some criteria fields based on the Field Headers.
Think of this section as a Page Field in a Pivot table. You do not necessarily have to setup your analysis in this manner. It is just a structure I use as it makes sense to me.

"Page Field" - Any criteria that is common to all formulas may be left in his section


"Row Labels"
- Any criteria that is unique to each formula may be placed in this section
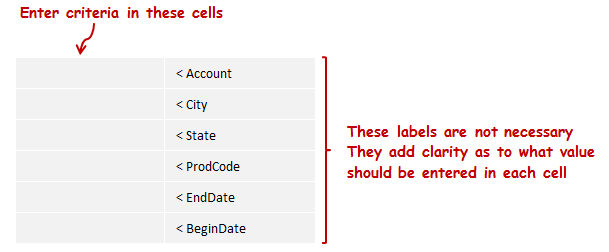


The Criteria

I entered all of the crieria in each cell that I am interested in


The Formula - Long Form

I wrote a formula using Excel Tables and Structured References


Not too bad. But it is a little long and hard to read. The image causes us to have to scroll left right on the blog post to see the whole thing so we lose clarity of what is on the left. I'll "wrap" the formula in the formula bar to see if that clears things up.

The Formula - Wrapped Form

To "Wrap the formula in the formula bar, click before the text where you want to insert a break, then hold down the [ALT] key and press [ENTER]. I'm going to add a break for each Field/Criteria set so each set is on its own line in the formula bar.


Looking better. I'll see what it looks like if I indent each line as well. To indent a line, use the space bar to mve the text to the right.

The Formula - Wrapped And Indented Form

I indented all lines after the first line to line up the name of the table.


I think this version is the easiest to read and understand.

The result


I drilled in to the data, In this instance, there was only 1 line item that met the criteria so validation of the formula results in this instance was easy.

Download a copy of the workbook

Let us know how you use wrap and indent in your formulas in the comments section below.


Gangnam Cell Styles...Delete

0
A reader on one of the LinkedIn Excel Groups recently asked how to delete cell styles from a workbook. Today, I'll show a possible solution.

The Cell Styles Group:


List Cell Styles:

I opened a workbook, Alt+F11 for the Visual Basic Editor and cooked up the code below. I then opened another workbook and made sure the first sheet was active by clicking on cell $A$1.

I then ran this code:

1:  Option Explicit
2:  Sub ListStyles()
3:    'List all styles in a workbook

4:    Dim C As Range
5:    Dim rng As Range
6:    Dim i As Long
7:    Dim lRows As Long

8:    With Application
9:      .ScreenUpdating = False
10:      .EnableEvents = False
11:    End With

12:    With ActiveWorkbook
13:      'Add a temporary sheet
14:       .Sheets.Add before:=Sheets(1)
15:      'List all the styles
16:       For i = 1 To .Styles.Count
17:        ActiveSheet.Cells(Rows.Count, 1).End(xlUp).Offset(1, 0) = _
18:          .Styles(i).Name
19:      Next i
20:    End With

21:    'Tidy up
22:     'Destroy objects
23:     Set rng = Nothing
24:     Set C = Nothing
25:     'Excel environment
26:     With Application
27:      .DisplayAlerts = True
28:      .EnableEvents = True
29:     End With
30:  End Sub  

This returned 47 different styles. I am not going to list them all here. They are included in the workbook that you may download at the end of the post. Your workbook may have more or less depending on any customizations you have already made to your workbook or if you are working on a workbook you received from someone else.

Once you have a list of the styles, you may edit the list for thes styles you wish to keep or leave them all on the list if you wish to delete them all.

Let's see what happens if we delete all of them, shall we? This will only impact Cell Styles. It will not impact Table Styles or Chart Styles.

Styles Group Before Delete:


Delete Cell Styles:

Here's the code I am going to use to delete all cell styles from the cell styles group.

1:  Option Explicit
2:  Sub ClearStyles()
3:    'Deletes all styles from the active workbook
4:    Dim lRows As Long
5:    Dim C As Range
6:    Dim rng As Range

7:    With Application
8:      .ScreenUpdating = False
9:      .EnableEvents = False
10:      .DisplayAlerts = False
11:    End With

12:    'Make sure to click on sheet with list of styles to be deleted
13:    'Assumes list begins in $A$1
14:     With ActiveSheet
15:      lRows = .Cells(Rows.Count, 1).End(xlUp).Row
16:      Set rng = Range(.Cells(1, 1), Cells(lRows, 1))
17:     End With

18:    With ActiveWorkbook
19:      For Each C In rng
20:        On Error Resume Next
21:        .Styles(C.Text).Delete
22:        .Styles(C.NumberFormat).Delete
23:      Next C
24:    End With

25:    'Tidy up
26:     'Destroy objects
27:     Set rng = Nothing
28:     Set C = Nothing
29:     'Excel environment
30:     With Application
31:      .ScreenUpdating = True
32:      .DisplayAlerts = True
33:      .EnableEvents = True
34:     End With
35:  End Sub

Bam!!


Deleted 46 out of 47. Apparently cannot delete all styles or at least the "Normal" style.

Chart styles still work


Excel Table styles still work


You may now add any custom styles to your workbook. But please, no Gangnam Style :-)
(Sorry Psi)


More on Styles and VBA from Jan Karlel Pieterse
Download the Cell Styles workbook here

How do you work with Cell Styles and VBA? Let us know in the comments section.


Are You Series(ous)?

0
Do you work with different series in your Excel charts?

Here is what I would like the final chart to loo like. Note the white dashed lines in front of the columns:

Setup:

I started with the chart I ended with in my last post, Points Of Interest.


I then added some data to a separate worksheet in my workbook to replicate the horizontal gridlines.

The horizotal gridline scale is in units of 10, so I will use the same scale for my series' that I create for the "fake" gridlines.


Note in Col A that I used the exact same scale that I used for Series 1 which is what was used to plot the column charts (Really 1 chart)

Also note that I put data that is used for formatting on a separate worksheet from "Value Data". This makes it easier to maintain data as it needs to updated overtime


1. Horizontal gridlines

I am going to add fake horizontal gridlines to the chart, so first I'l remove the current horizontal gridlines.
  • Click on the chart (This will activate the Chart Tools Group on the Ribbon)
  • Click on "Layout" in the chart tools group
  • Click on gridlines
  • Click on Primary Horizontal Gridlines
  • Click on "None"


2. Add "Fake" horizontal gridlines

I copied all data from the formatting tab including the horizontal axis column, clicked on my chart and pasted the new series.

 I could click on each of the new series on the chart and change the chart type from column to line and apply all of the formatting. But I would like to do it with VBA. So I'll step through each part of the process separately
 

3. Change the chart type:

First I need to chage the chart type for each series that is not a value series which was series 1. So I'll loop through the SeriesCollection starting at number 2

1:  Option Explicit
2:  Sub SetChartType()
3:    Dim wb As Workbook
4:    Dim ws As Worksheet
5:    Dim i As Integer
6:    Set wb = ThisWorkbook
7:    Set ws = wb.Worksheets("Sheet1")
8:    With ws
9:      .ChartObjects(1).Activate
10:      For i = 2 To .ChartObjects(1).Chart.SeriesCollection.Count
11:        .ChartObjects(1).Chart.SeriesCollection(i).ChartType = xlLine
12:      Next i
13:    End With
14:    'Tidy up
15:      Set ws = Nothing
16:      Set wb = Nothing
17:  End Sub


4. Format the color of the lines

I would like each of the horizontal lines to be white

1:  Option Explicit
2:  Sub SetChartColor()
3:    Dim wb As Workbook
4:    Dim ws As Worksheet
5:    Dim i As Integer
6:    Dim lWhite As Long
7:    Set wb = ThisWorkbook
8:    Set ws = wb.Worksheets("Sheet1")
9:    lWhite = RGB(255, 255, 255)
10:    With ws
11:      .ChartObjects("Chart 1").Activate
12:      With ActiveChart
13:        For i = 2 To .SeriesCollection.Count
14:          .SeriesCollection(i).Select
15:          With Selection
16:            .Format.Line.ForeColor.RGB = lWhite
17:          End With
18:        Next i
19:      End With
20:    End With
21:    'Tidy up
22:      Set ws = Nothing
23:      Set wb = Nothing
24:  End Sub  


5. Change the line type:

The chart is looking pretty good. But the lines are a little thick, I would like something more subdued. I played around a bit with different line weights and dash styles until I found values that I liked

1:  Option Explicit
2:  Sub SetLineProperties()
3:    Dim wb As Workbook
4:    Dim ws As Worksheet
5:    Dim i As Integer
6:    Dim lWhite As Long
7:    Set wb = ThisWorkbook
8:    Set ws = wb.Worksheets("Chart")
9:    lWhite = RGB(255, 255, 255)
10:    With ws
11:      .ChartObjects("Chart 1").Activate
12:      With ActiveChart
13:        For i = 2 To .SeriesCollection.Count
14:          .SeriesCollection(i).Select
15:          With Selection
16:            .Format.Line.Weight = 1.5
17:            .Format.Line.DashStyle = msoLineRoundDot
18:          End With
19:        Next i
20:      End With
21:    End With
22:    'Tidy up
23:      Set ws = Nothing
24:      Set wb = Nothing
25:  End Sub  

I added the major horizontal gridlines back to the chart and made them very thin and light grey

The final chart:


The lines may be a little thin for your tastes, just adjust the line weight until you get the effect you are trying to achieve.

I hope you enjoy the post and that you find something of value in it.

Additional resources:
How do you use the SeriesCollection in your VBA or work with series in your charts? Let us know in the comments below.